
Data Analysis
Introduction to Data Analysis:
Data Analysis questions require you to analyze data (shocking, I know). This data can be presented to you in various ways: graphed relationships, scatterplots, frequency charts, tables, histograms, box and whisker plots, and bar graphs are all on the table here, so make sure you’re comfortable with how each one is structured!
Even though data can come in many forms, there are general strategies you should use to tackle every problem: DIAGRAM the charts based on the axes/columns. Pay special attention to the units used, and ask yourself, “What does the author want me to take away from this?” If it sounds like the metacognition work from the reading section, it’s because thi
Key Concepts:
Let’s take a look at a few specific charts with key components that may not be easily understood with just a glance:
1. Box and Whisker Plots
These plots divide a dataset into four equal sections, separated by boundary lines called quartiles. No matter how wide or narrow a section looks visually, every single section contains exactly 25% of the data points.
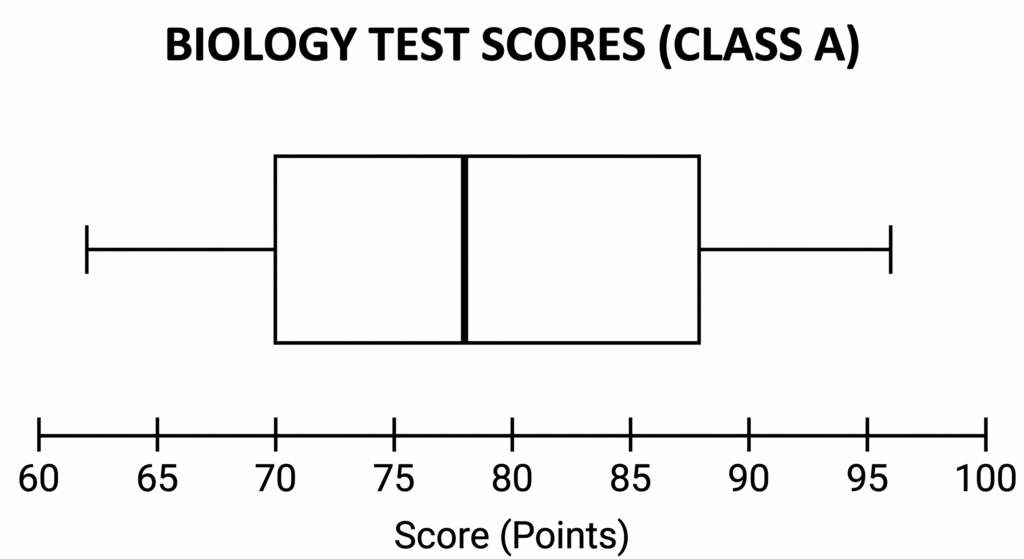
- The Left Whisker (Minimum to Q1): Contains the lowest 25% of the data.
- The Left Box (Q1 to Q2): Contains the second lowest 25% of the data.
- The Right Box (Q2 to Q3): Contains the second highest 25% of the data.
- The Right Whisker (Q3 to Maximum): Contains the highest 25% of the data.
Beyond this, all you must know is that the center line dividing the box denotes the MEDIAN (not the mean) of the dataset, and the total range can be found by taking the difference between the far tips of the two whiskers. Since we don’t
2. Frequency Charts
Often, data can be separated into multiple categories. If you were measuring the wingspans of a flock of chickadees in Mexico, you might sort the data like this:
| Wingspan | Number of Birds |
| 15 cm | 24 |
| 16 cm | 55 |
| 17 cm | 56 |
In this frequency chart, we report how many birds we found with each wingspan. For example, there were exactly 24 birds with a 15 cm wingspan.
Finding the median of this dataset may seem tricky. Locating the center of a tiny dataset of 5 values is trivial, but what’s the exact middle of 135 birds? Don’t worry; there’s a shortcut. Simply add 1 to the total number of data points, then divide by 2!
- Just as the exact center position of a dataset of 5 is \(\frac{5 + 1}{2}= 3\) (the 3rd position),
- The exact center position of a dataset of 135 is \(\frac{135 + 1}{2} = 68\) (the 68th position).
Looking back at our table, the first 24 data points are 15 cm. The next 55 data points are 16 cm (which covers positions 25 through 79). Therefore, the data point sitting right at position 68 will definitively be 16 cm!
3. Histograms:
Histograms give visual summaries of data ranges, sorting data points into columns called “bins.” Crucially, note that histograms don’t give exact values! We CANNOT calculate the exact mean, median, mode, or range from a histogram—a sad reality we must all live with every day. However, we can determine the RANGE in which some of these data metrics lie! Check this out:
Imagine a histogram showing the heights of students at Tall Kids High School. We see that most students are above six feet tall, but we don’t know their exact, individual heights! However, we can infer the range in which the median appears:

- About 100 students are below 6 feet.
- About 350 students are between 6 feet and 7 feet.
- About 100 students are above 7 feet.
This means we have 550 students total. Using our shortcut, our median value will appear at the position: \(\frac{550 + 1}{2}= 275.5\).
Counting up from the bottom 100 students, the 275th position lands squarely inside the middle bin. Therefore, we know for a fact the median height is somewhere in the 6 ft – 7 ft range!
In this histogram, we see that most students at Tall Kids High School are above six feet tall, but we don’t know their exact heights! However – we can infer the range in which the median appears: it looks like about 100 students are below six feet, about 350 students are between six feet and seven feet, and about 100 students are above seven feet. This means we have 550 students total, so our median value will appear at the position: \( \frac{550+1}{2} =275.5\). This is squarely in the “6 ft – 7 ft” range!
Now go forth, and have fun in the problem set!